Outcome
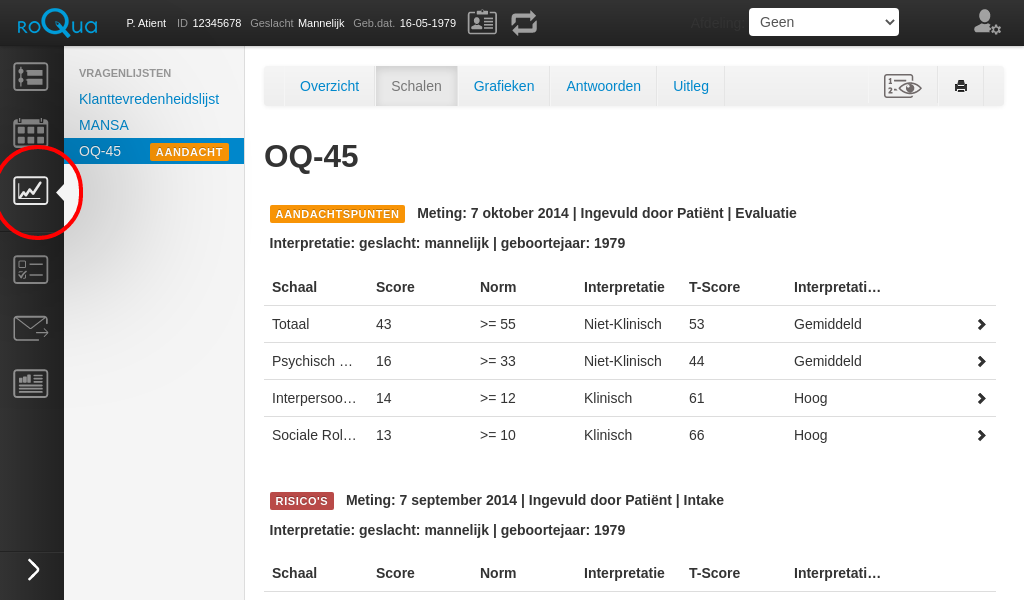
"Outcome" is generated on the basis of the completed questionnaires. Click on the ![]() -icon to view this "outcome". All completed questionnaires are listed on the left side of the screen. The "Scales" tab displays the calculated scale scores with the corresponding answers per measurement moment for the selected questionnaire.
-icon to view this "outcome". All completed questionnaires are listed on the left side of the screen. The "Scales" tab displays the calculated scale scores with the corresponding answers per measurement moment for the selected questionnaire.
- Click the
 button to the right of a scale score to see the answers on which it is based
 - Click the
 button to print the displayed results
 - A red gradient indicates that a calculated scale score or individual response indicates a risk
- A yellow gradient indicates that there are points of attention in the completed questionnaire
- A
 indicates clinically relevant progress
 - A
 indicates clinically relevant decline
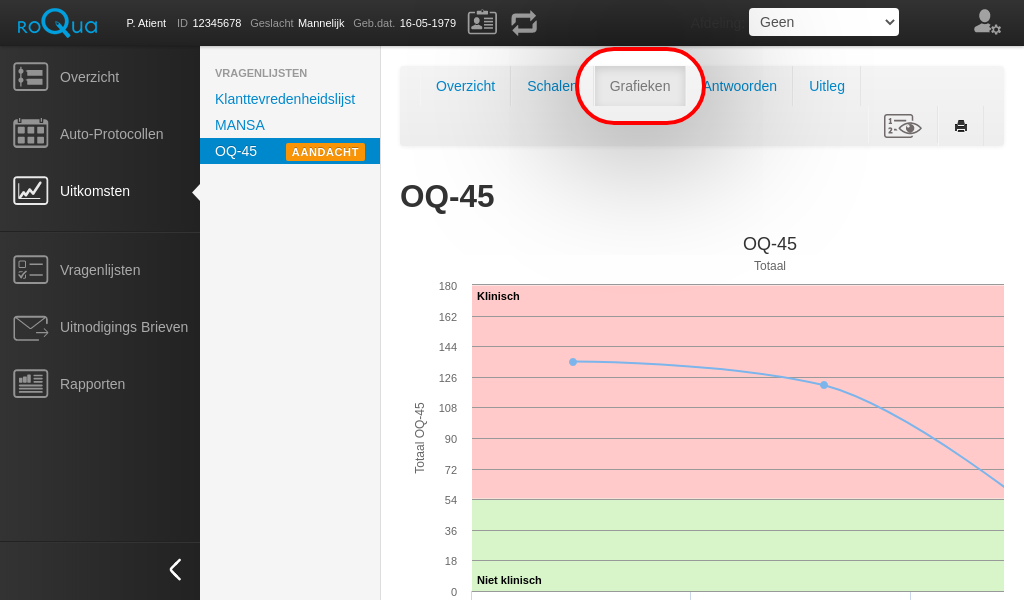
Click on the "Graphs" tab for a graphical representation of the calculated scale scores over time.
- Click the button to print the displayed results
- By moving the mouse over the measuring points in the graph, additional information appears
- Click on the "Download" link at the top right of a graph to save it as an image
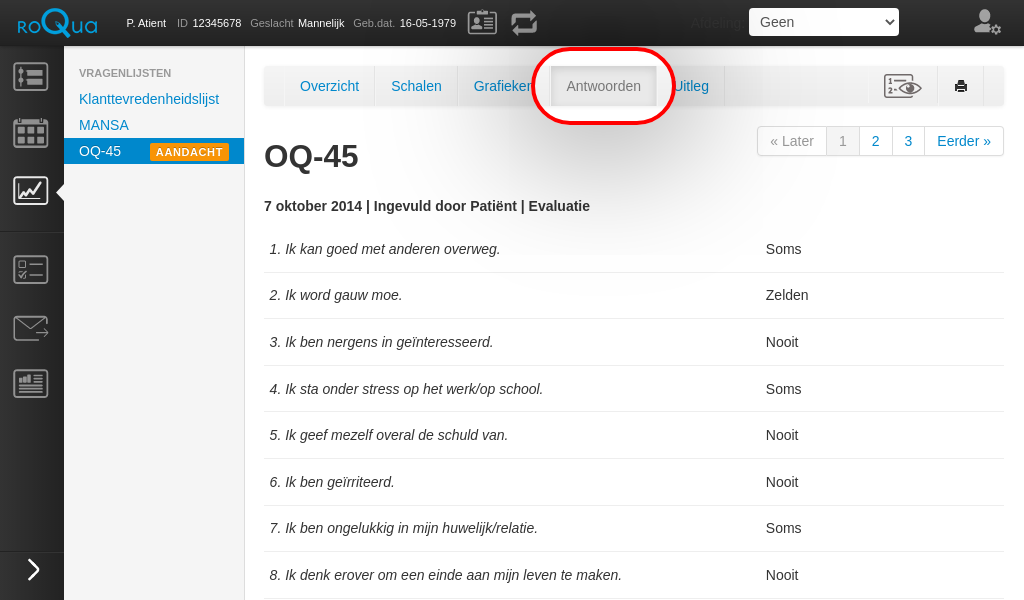
Click on the "Answers" tab to view all the answers for this questionnaire.
- Click the button to print the displayed results
- Click the "Earlier" and "Later" buttons at the top to view earlier and later questionnaires